Monitoring & Alerting
Automatic Blackbox Monitoring
Tip
All ingresses are automatically scraped by the Blackbox Prober. These metrics are visualized in the Blackbox Prober Dashboard. This is achieved by leveraging kubernetes_sd_config.
Prometheus
Collecting Prometheus Metrics
If your application exposes Prometheus metrics, you can use a ServiceMonitor to collect them:
apiVersion: v1
kind: Service
metadata:
  name: atlas
  labels:
    app: atlas
spec:
  ports:
  - port: 80
    name: http
    protocol: TCP
    targetPort: 3001
  - port: 9090
    name: metrics
    protocol: TCP
    targetPort: 9090
  selector:
    app: atlas
---
apiVersion: monitoring.coreos.com/v1
kind: ServiceMonitor
metadata:
  name: atlas
  namespace: monitoring
  labels:
    release: kube-prometheus-stack # Important: Required for Prometheus to pick up the monitor
spec:
  selector:
    matchLabels:
      app: atlas # Must match the Service labels
  endpoints:
    - port: metrics # Must match the name of the metrics port in the Service
      interval: 30s
      scheme: http
Container Logs
We run Grafana Alloy as a DaemonSet that tails container logs from each node and ships them to the in-cluster Loki, where they're queryable in Grafana alongside metrics and traces (see ADR-0012).
Log collection is opt-in
Alloy only collects logs from pods that explicitly opt in with an annotation. A workload with no annotation produces no logs in Loki.
Opting a workload in
Add the annotation to the pod template (spec.template.metadata.annotations) — not the
Deployment's own metadata — because Alloy discovers pods, not Deployments:
apiVersion: apps/v1
kind: Deployment
metadata:
  name: example-app
spec:
  template:
    metadata:
      annotations:
        logs.alloy.io/collect: "true" # opt in to Alloy -> Loki log collection
    spec:
      containers:
        - name: example-app
          image: ...
Once the pod rolls with the annotation, its logs appear in Loki within ~30s. Alloy attaches the
namespace, pod, container, and app (from app.kubernetes.io/name) labels to each stream.
Querying logs in Grafana
Open Grafana for the cluster you're targeting and sign in with your ClearRoute account (Azure AD SSO):
| Cluster | Grafana URL |
|---|---|
| dev | https://grafana.dev.clearroute.io |
| prod | https://grafana.clearroute.io |
Then:
- Left nav → Explore (compass icon).
- At the top of the Explore view, open the datasource dropdown and select
Loki. (The dropdown also listsPrometheus/Mimirfor metrics andTempofor traces — logs live only in Loki.) - Use the Label filters builder — pick
namespace,app, orcontainerand its value — or switch to Code mode and write LogQL directly. - Set the time range (top-right) and hit Run query. Use Live to tail in real time.
Alloy attaches these stream labels, which are your primary query selectors:
| Label | Source |
|---|---|
namespace |
pod namespace |
pod |
pod name |
container |
container name |
app |
pod label app.kubernetes.io/name (empty if the pod doesn't set it) |
LogQL examples (Explore → Code mode):
# all logs from a namespace
{namespace="example-app"}

# a specific container, filtered to lines containing "error"
{app="example-app", container="example-app"} |= "error"

# case-insensitive regex match across a namespace
{namespace="example-app"} |~ "(?i)timeout|refused"

# parse JSON logs and filter on a field
{app="example-app"} | json | level="error"
Datasource picker
Prometheus is the default datasource, so a fresh Explore tab won't show logs until you switch
the picker to Loki. If a query returns nothing, first confirm the datasource, then that the
workload's pod template carries logs.alloy.io/collect: "true".
Persistence
Logs are persisted by Loki → S3 (constellation-loki-<env> bucket, 90-day retention
Alerting
How to Add an Alert
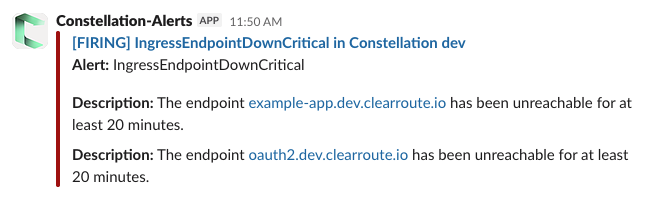
Below is an example PrometheusRule manifest. When triggered, it sends an alert to the #constellation-notifications Slack channel:
apiVersion: monitoring.coreos.com/v1
kind: PrometheusRule
metadata:
  name: ingress-blackbox-probe-success
  labels:
    release: kube-prometheus-stack
spec:
  groups:
    - name: IngressBlackboxProbes
      rules:
        - alert: IngressEndpointDown
          expr: max_over_time(probe_success{job="scrapeConfig/blackbox-exporter/ingresses"}[5m]) == 0
          for: 2m
          labels:
            severity: warning
            team: platform
            namespace: monitoring
          annotations:
            summary: Ingress Endpoint down
            description: The endpoint {{ $labels.instance }} has been unreachable for at least 5 minutes.
        - alert: IngressEndpointDownCritical
          expr: max_over_time(probe_success{job="scrapeConfig/blackbox-exporter/ingresses"}[15m]) == 0
          for: 5m
          labels:
            severity: critical
            team: platform
            namespace: monitoring
          annotations:
            summary: "Endpoint down for 20+ minutes"
            description: The endpoint {{ $labels.instance }} has been unreachable for at least 20 minutes.
Grafana
How to Add a Custom Grafana Dashboard
To add a custom dashboard:
- Place your dashboard JSON file in
argocd/kube-prometheus-stack/dashboards/. - Update
argocd/kube-prometheus-stack/kustomization.yamlto include your file in theconfigMapGenerator.
Tip
- The
grafana_dashboardlabel is required! - The
grafana_folderannotation specifies the Grafana folder for the dashboard.
apiVersion: kustomize.config.k8s.io/v1beta1
kind: Kustomization

configMapGenerator:
  - name: dashboard
    files:
      - ./files/dashboard.json
    options:
      disableNameSuffixHash: true
      labels:
        # https://docs.syseleven.de/metakube-accelerator/building-blocks/observability-monitoring/kube-prometheus-stack#adding-grafana-dashboards
        grafana_dashboard: "1"
      annotations:
        # has been specified in sidecar.dashboards.folderAnnotation in helm-values/kube-prometheus-stack-values.yaml
        grafana_folder: ClearRoute
Claude Code Telemetry
We self-host an OpenTelemetry backend so we can see how Claude Code is actually used across the company — cost, token usage, sessions, lines changed, commits/PRs, and qualitative events (prompts submitted, tool accept/reject decisions, API errors).
Architecture
Claude Code on a developer laptop sends OTLP over HTTPS to a collector, which fans the data out to the existing Prometheus (metrics) and Loki (events). It's all visualised in the existing Grafana via the Claude Code dashboard.
Laptop (Claude Code)  ──OTLP/HTTP + Bearer token──►  otel.<cluster>.clearroute.io (Traefik/TLS)
                                                          │
                                              OTel Collector gateway  (ns: otel-collector)
                                                ├─ metrics ─► Prometheus (ServiceMonitor scrape)
                                                └─ events  ─► Loki  (native OTLP, ns: monitoring)
                                                          │
                                                   Grafana ◄── "Claude Code" dashboard
Components (all GitOps, dev cluster first):
| Piece | Where |
|---|---|
| OTel Collector gateway + ingest auth + ServiceMonitor + dashboard | applications/argocd/dev/otel-collector.yaml, applications/management/otel-collector/ |
| Loki (single-binary, S3-backed via IRSA) | applications/argocd/dev/loki.yaml |
Loki datasource (uid: loki) |
grafana.additionalDataSources in applications/argocd/dev/kube-prometheus-stack.yaml |
| S3 bucket, Loki IRSA role, ingest-token secret | infra/loki.tf, infra/otel_collector.tf, irsa.loki in infra/clusters/dev.tfvars |
The ingest endpoint is authenticated with a shared bearer token stored in AWS Secrets Manager
(constellation/otel-collector → ingest_token) and validated by the collector. Event
content is redacted by default — we capture metadata and counts, not prompt text or command
bodies.
Pointing Claude Code at the endpoint (PoC)
For the PoC, volunteers add this to their user settings ~/.claude/settings.json (get the
token from the constellation/otel-collector secret):
{
  "env": {
    "CLAUDE_CODE_ENABLE_TELEMETRY": "1",
    "OTEL_METRICS_EXPORTER": "otlp",
    "OTEL_LOGS_EXPORTER": "otlp",
    "OTEL_EXPORTER_OTLP_PROTOCOL": "http/protobuf",
    "OTEL_EXPORTER_OTLP_ENDPOINT": "https://otel.dev.clearroute.io",
    "OTEL_EXPORTER_OTLP_HEADERS": "Authorization=Bearer <ingest_token>",
    "OTEL_EXPORTER_OTLP_METRICS_TEMPORALITY_PREFERENCE": "cumulative",
    "OTEL_RESOURCE_ATTRIBUTES": "deployment.environment=clearroute"
  }
}
Production rollout (deferred)
For fleet-wide enforcement, the same block is promoted to managed settings via MDM
(likely Jamf — to be confirmed) as a managed-settings.d/10-telemetry.json fragment or a
com.anthropic.claudecode configuration profile. Managed settings can't be overridden by
users. See Anthropic's MDM templates: https://github.com/anthropics/claude-code/tree/main/examples/mdm.
Verifying
curl https://otel.dev.clearroute.io/v1/metrics→401/403without a token.- Prometheus → Targets: the
otel-collectortarget isUP; queryclaude_code_session_count_total. - Grafana → Explore (Loki):
{service_name="claude-code"}showsclaude_code.user_prompt,claude_code.tool_decisionevents (metadata only). - Grafana → the Claude Code dashboard populates.